Tags
First, a little context. My first year of teaching was in 2009-2010. I was straight out of undergrad and had just turned down Teach for America to teach at a little-known private K-8 school in the DC suburbs, with the goal of learning the craft of teaching in a low-stress, low-stakes environment (or at least what I thought would be a low-stress low-stakes environment). It did help that I had 37 math students that year. Not 37 per class. 37 total. Class sizes of 8-10.
The day I interviewed for the job, my future principal responded to my question about the school’s pedagogical approach by saying, “If you swing naked from a chandelier, and they learn math, we’re all good.” So there was also some freedom.
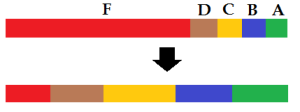
My assessment system began with a realization that occurred to me in grade school: the normal grade scale on tests (90-100 = A range, 80-89 = B range, etc.) was total BS. If an A is supposed to represent exemplary work, a B average work, and C, D, F some levels below average, how did these multiples of 10 become the magic cutoffs? Test scores were as much about the test as they were about the kids. In designing a test, a teacher could make every kid get an A, or could make no kids get an A. What most of my teachers opted for was to make 70% easy enough for just about everyone, 20% of it somewhat challenging and then 10% of it really challenging. Then, the multiples of ten as the magic cutoffs more or less worked out. Personally, I always thought that first 70% was a colossal waste of everyone’s time and only there to make the grade range work (yes, I know I was a weird kid probably destined to be a teacher).
So here was the crazy grading system that my principal probably shouldn’t have allowed though I’m grateful that he did. In short, I wanted to eliminate the freebie questions that made students fall between 80%-100%. I wanted to have students engage with really challenging math – really be pushed to their limit – on tests. I wanted them to tackle each test with focus, intensity and perseverance that they didn’t know they had, and for that, I needed to construct rigorous tests that would push them as such. I envisioned low scores percentage-wise, so I was prepared to scale the scores to preserve their precious GPAs.
So I gave really hard tests where kids usually fell between 20%-80%. Once I scored the tests (my turnaround time was usually 24 hours at my ripe age), I would pass them back and we would discuss the challenging problems as a class. I would let them amend their tests for half-points. After that, I would re-score them and do a little statistical analysis to determine the A-B-C-D-F cutoffs. It was not uncommon for students to come home with a 61% that said “B” on it.

In fact, letter grades ended up being the same as other teachers, except in my class students repeatedly studied their butt off to prepare for being pushed to their mathematical limit and persevered on really hard problems (if not on the first try, then usually on the second). A kid felt proud of their 61% that earned them a B.
The system wasn’t without its flaws. On the first test, for instance, I gave every problem a point value so that together they added up to 100. Parents flipped when they saw the raw scores on that first test. After that, I disguised their low percentages with point values for a test that summed to random numbers, like 238. Soon after that, I removed all references to point values all together. There was another big flaw that I noticed, and the realization of that flaw became a “lightbulb moment” that changed how I think about assessment. More on that next!
Pingback: The SBG Lightbulb Moment | The Limit Does Not Exist