The last time I had kids make charts about their lives, I was teaching middle school in Virginia and it was 2009. After a 5-year hiatus, the project is back. But, like just about everything in my life when compared to 2009, the 2014 version bore almost no resemblance to its former self. For that, I can thank Dan Meyer, Nicholas Felton, a team of teachers that I meet with weekly on Google Hangout who helped plan, a bunch of different tech companies, and kids that proved to be really interesting individuals and incredibly tech savvy.
Though I don’t have any student work from 2009 to compare, the final products for the 2014 Infographic Project have blown my mind. I’m going to share a handful of student work below (all with permission). I can’t wait to write a post (or 7) about everything that happened under the hood to make these come to be. Until then, I give to you in no particular order, a smattering of the informative/hilarious/ clever/odd/worrisome/adorable infographics by my 9th graders:
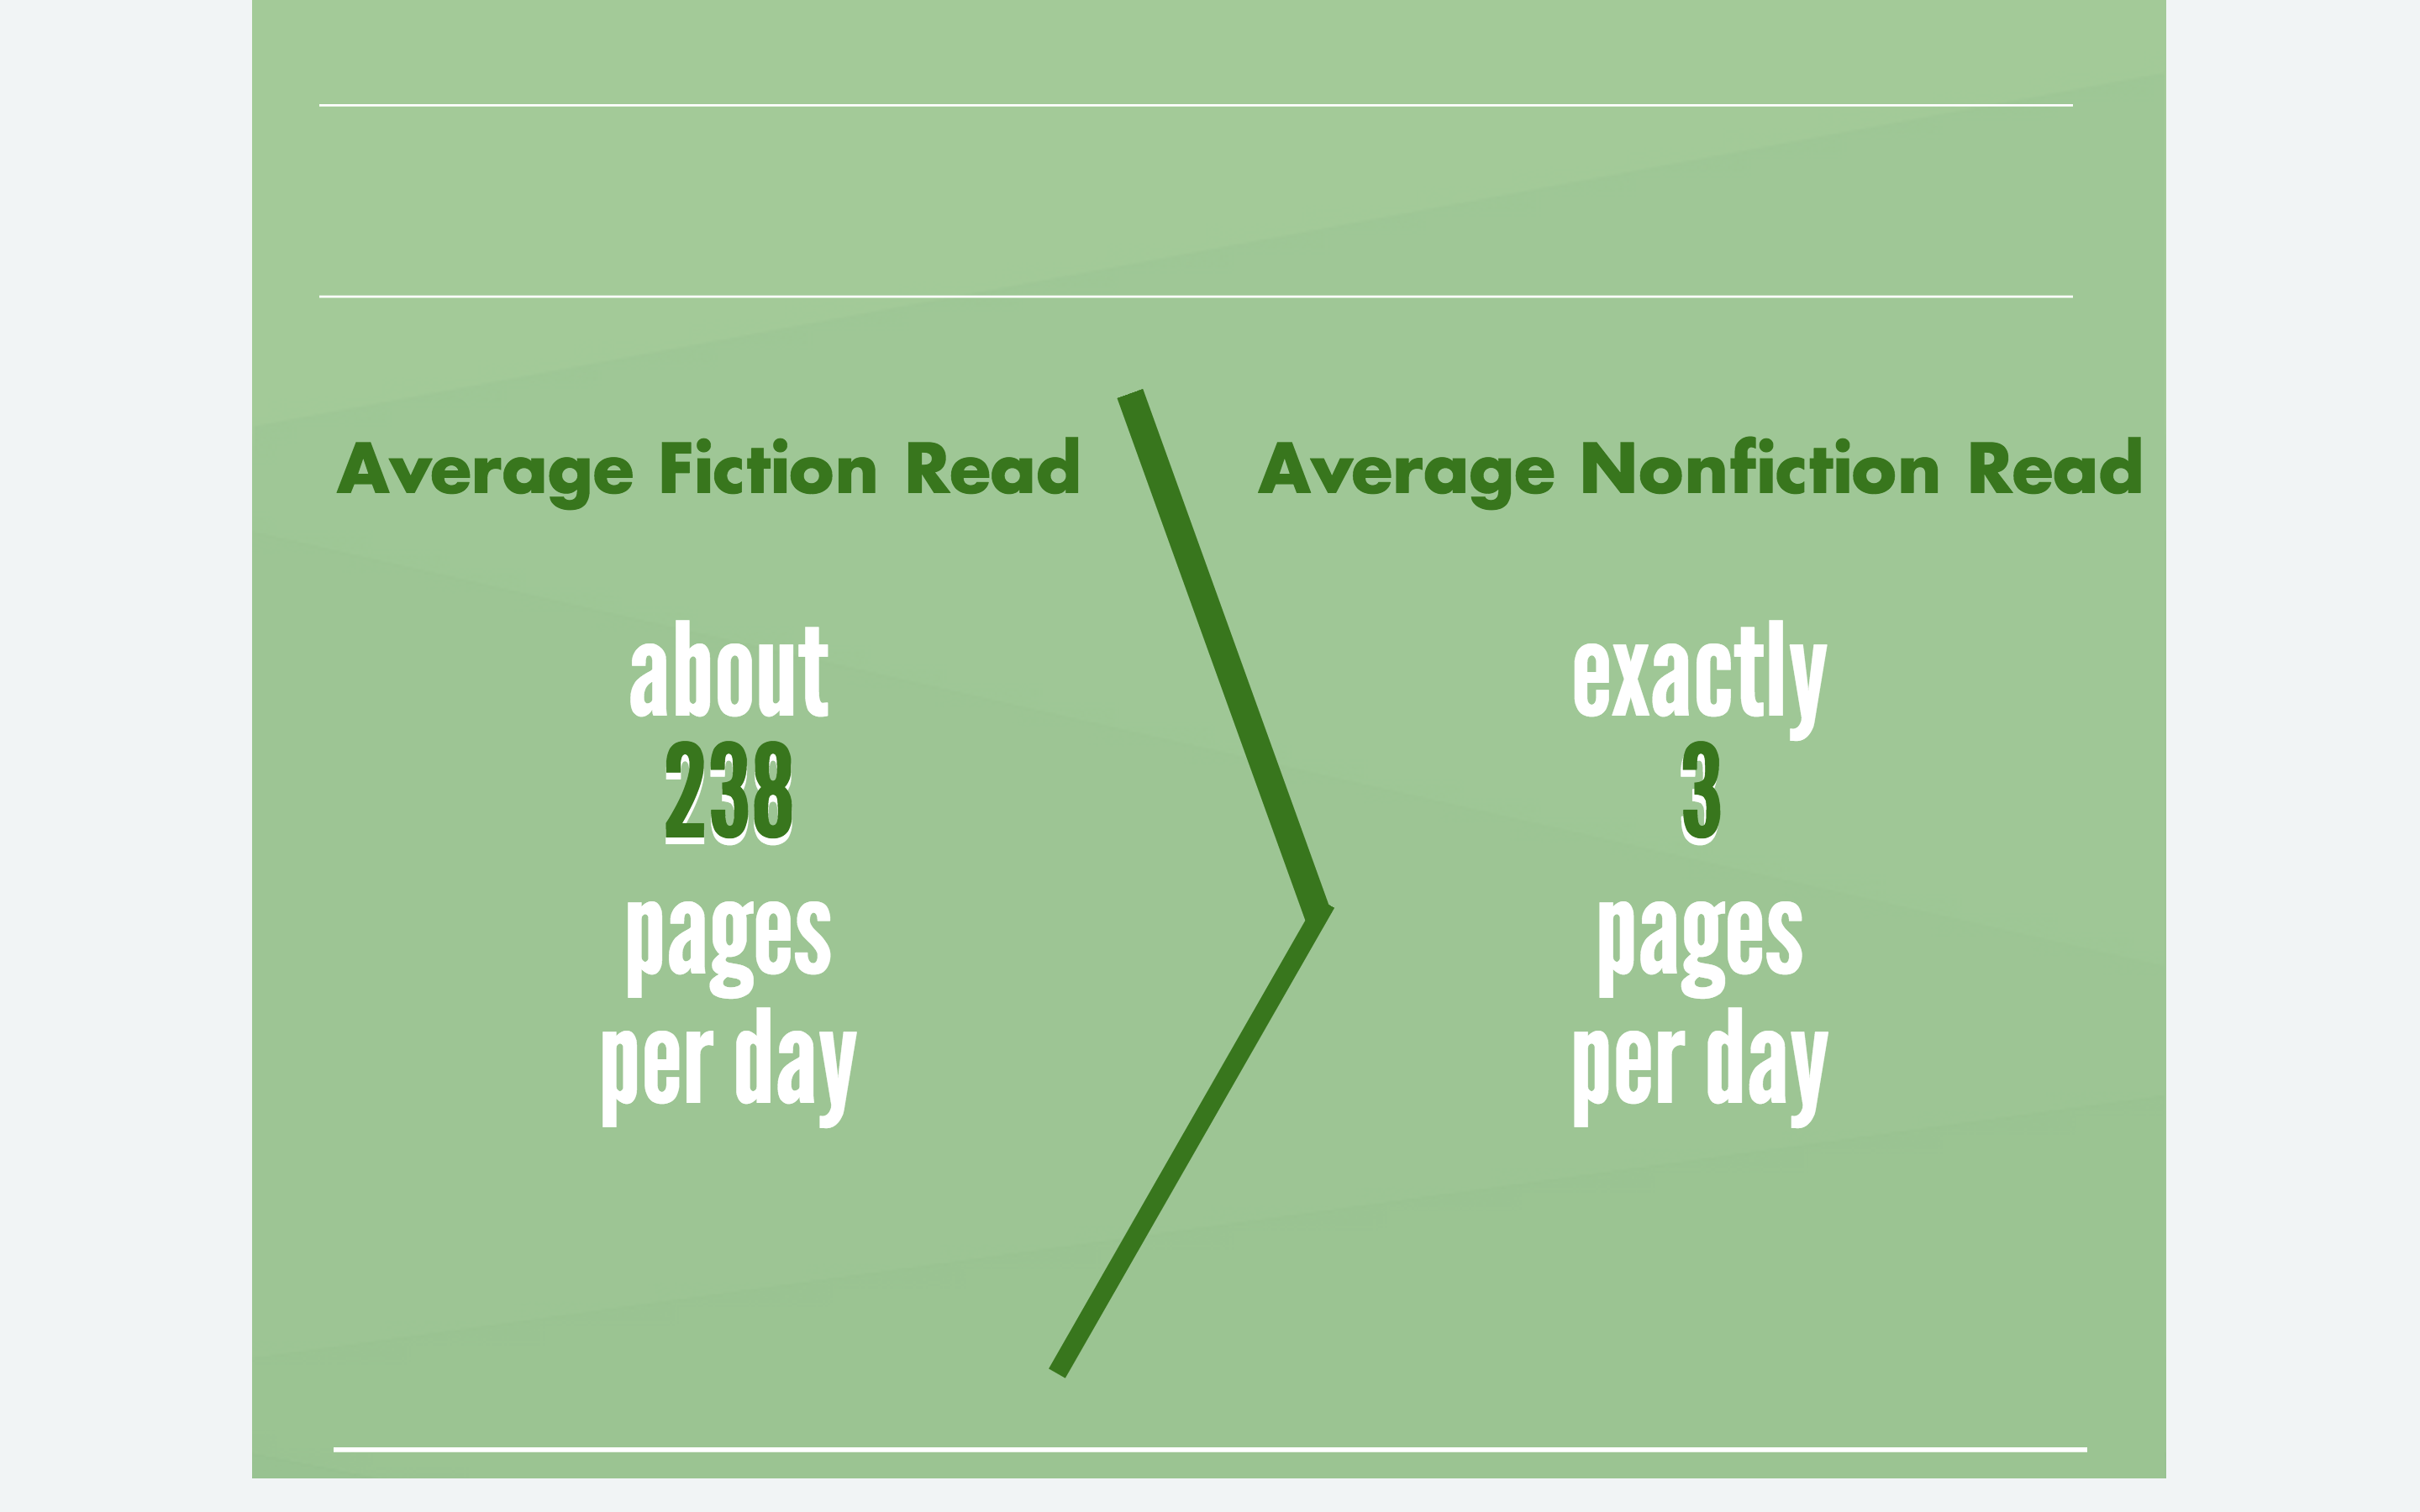


(I’ve never heard this student curse once)


(Doesn’t it just warm your heart?)

(Um, hold on, sub-genres WITHIN genres?)
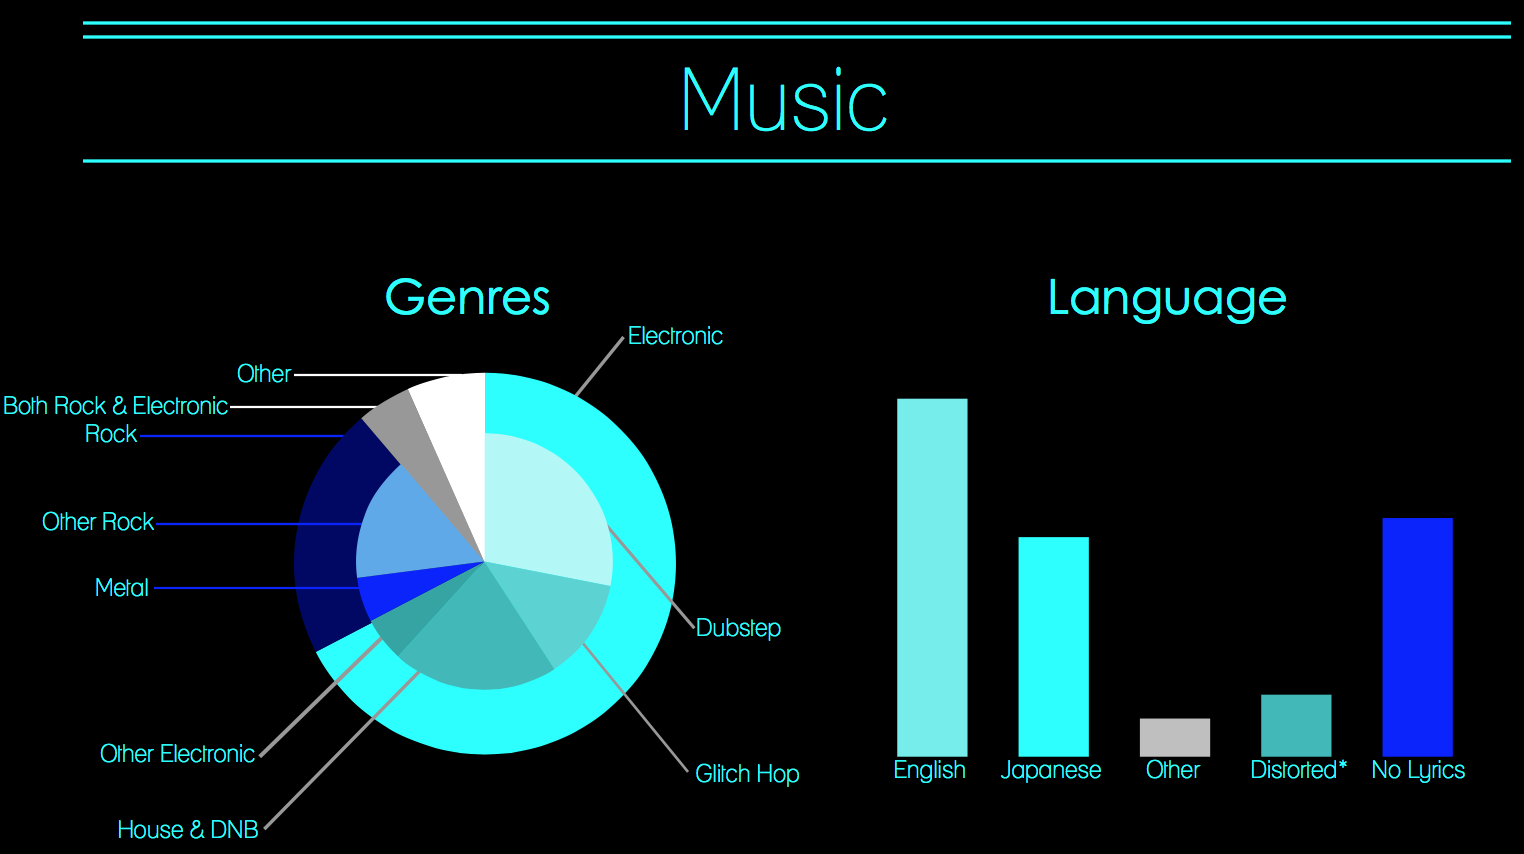
(consoles WITHIN games? Come on!)
I did find it a little strange that this student was recording every time he saw me, including during our Expeditions (intersession) weeks
A bigger collection:

I’ve been looking fot the follow-up post(s) of how you took the students through this project. Would you be willing to elaborate on the sequence of lessons & activities? THANKS.