I left off last post asking how one could restrict the domain and range of the graph on the left to look like the graph on the right (i.e. excluding all negatives values), in terms of the many parameters involved.
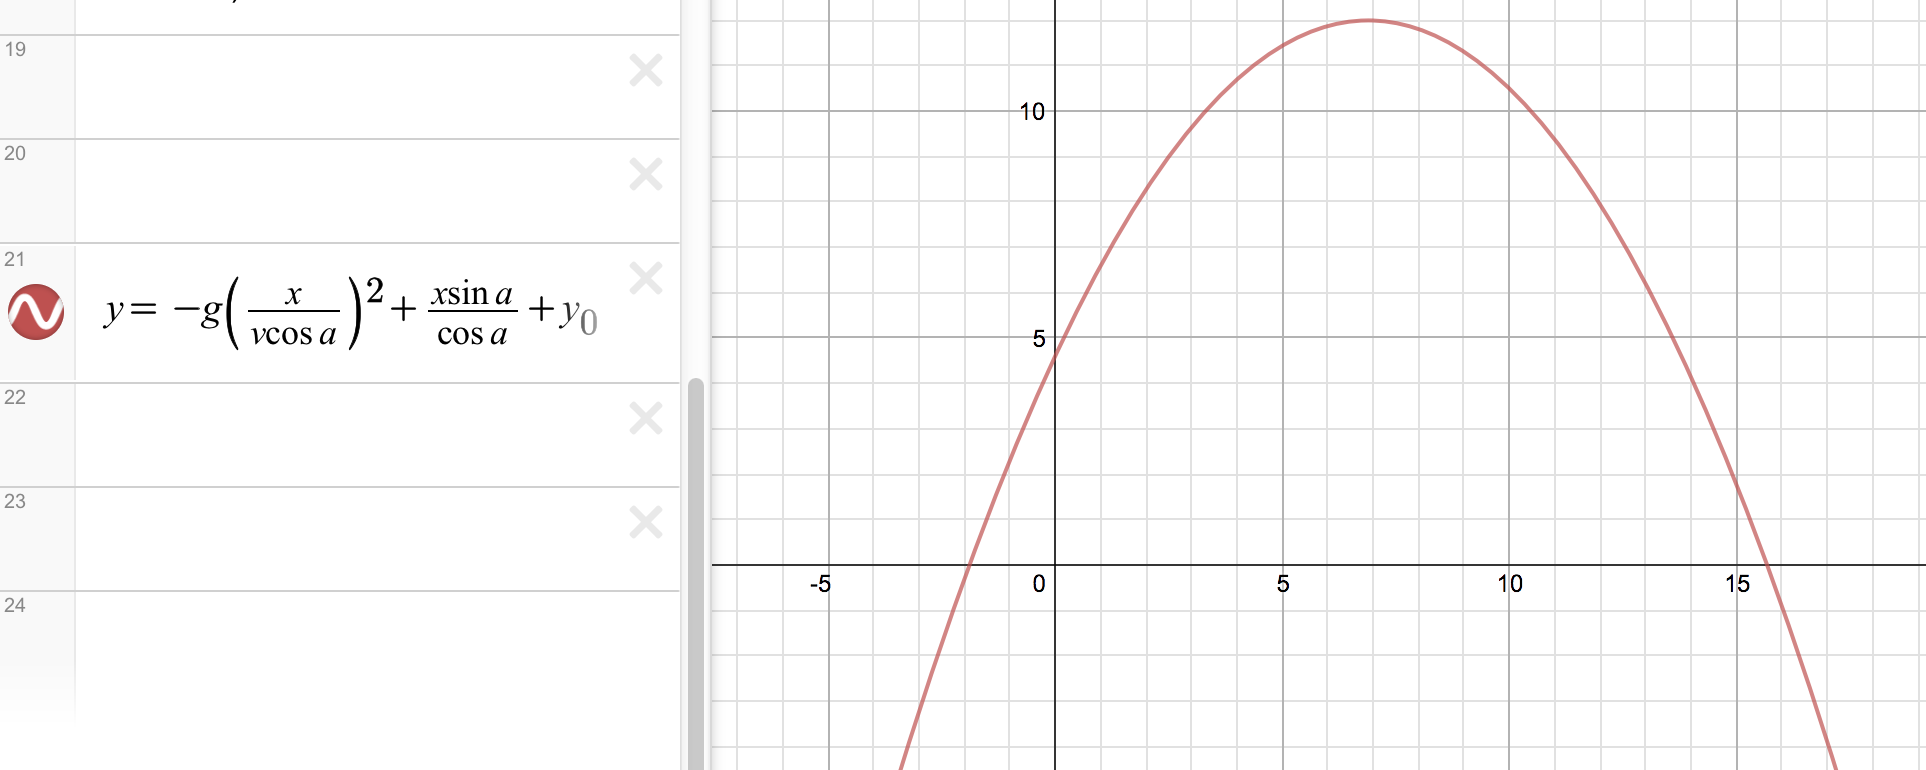

The catch is, we’re playing by “old Desmos” rules where you can only restrict the domain OR the range; not both.
So, here comes the small handful of students who wanted to take this on (remember: they were pushing this much more than I was. They desperately wanted to fix their graph; or perhaps they were gripped by a problem that, for the first time all year, they couldn’t solve in a few minutes).
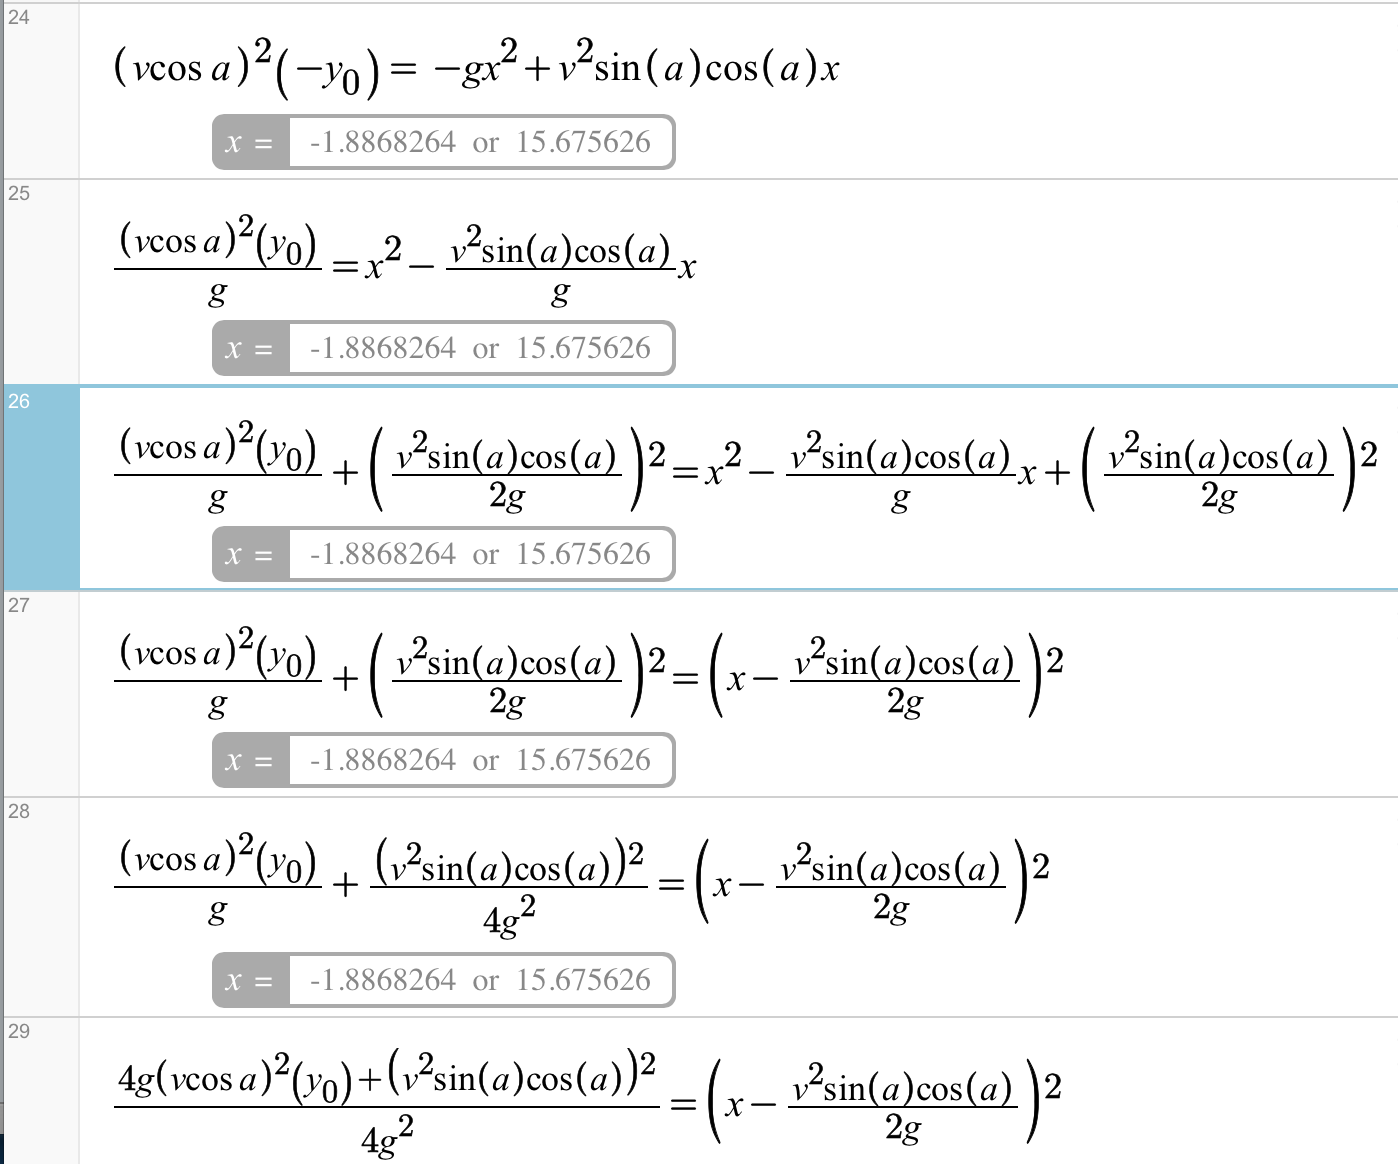
They knew a compound inequality would be necessary; a low bound and a high bound. They started by trying the range, but then quickly changed course when they realized that, with the range, they kind of wanted two lower bounds and no upper bounds? Sort of? But how would that work?
So it was going to have to be domain. The lower bound of the domain was easy: 0. But that damn upper bound. How could they find that x-intercept in terms of gravity, velocity, starting height and angle of launch? What I’m about to share can only be described as the COOLEST THING EVER DONE BY ALGEBRA 1 STUDENTS:

Besides absolute awesomeness, do we see what’s happening here? Not only are they solving for the x-intercept, but they have TWO systems for ensuring accuracy every step along the way: Desmos spewing out the same answer on each line, and that answer matching the x-intercepts that they can see on the graph.
What we have now is the hardest completing the square problem ever. I’ll link to the rest of their line-by-line solution and paste below:


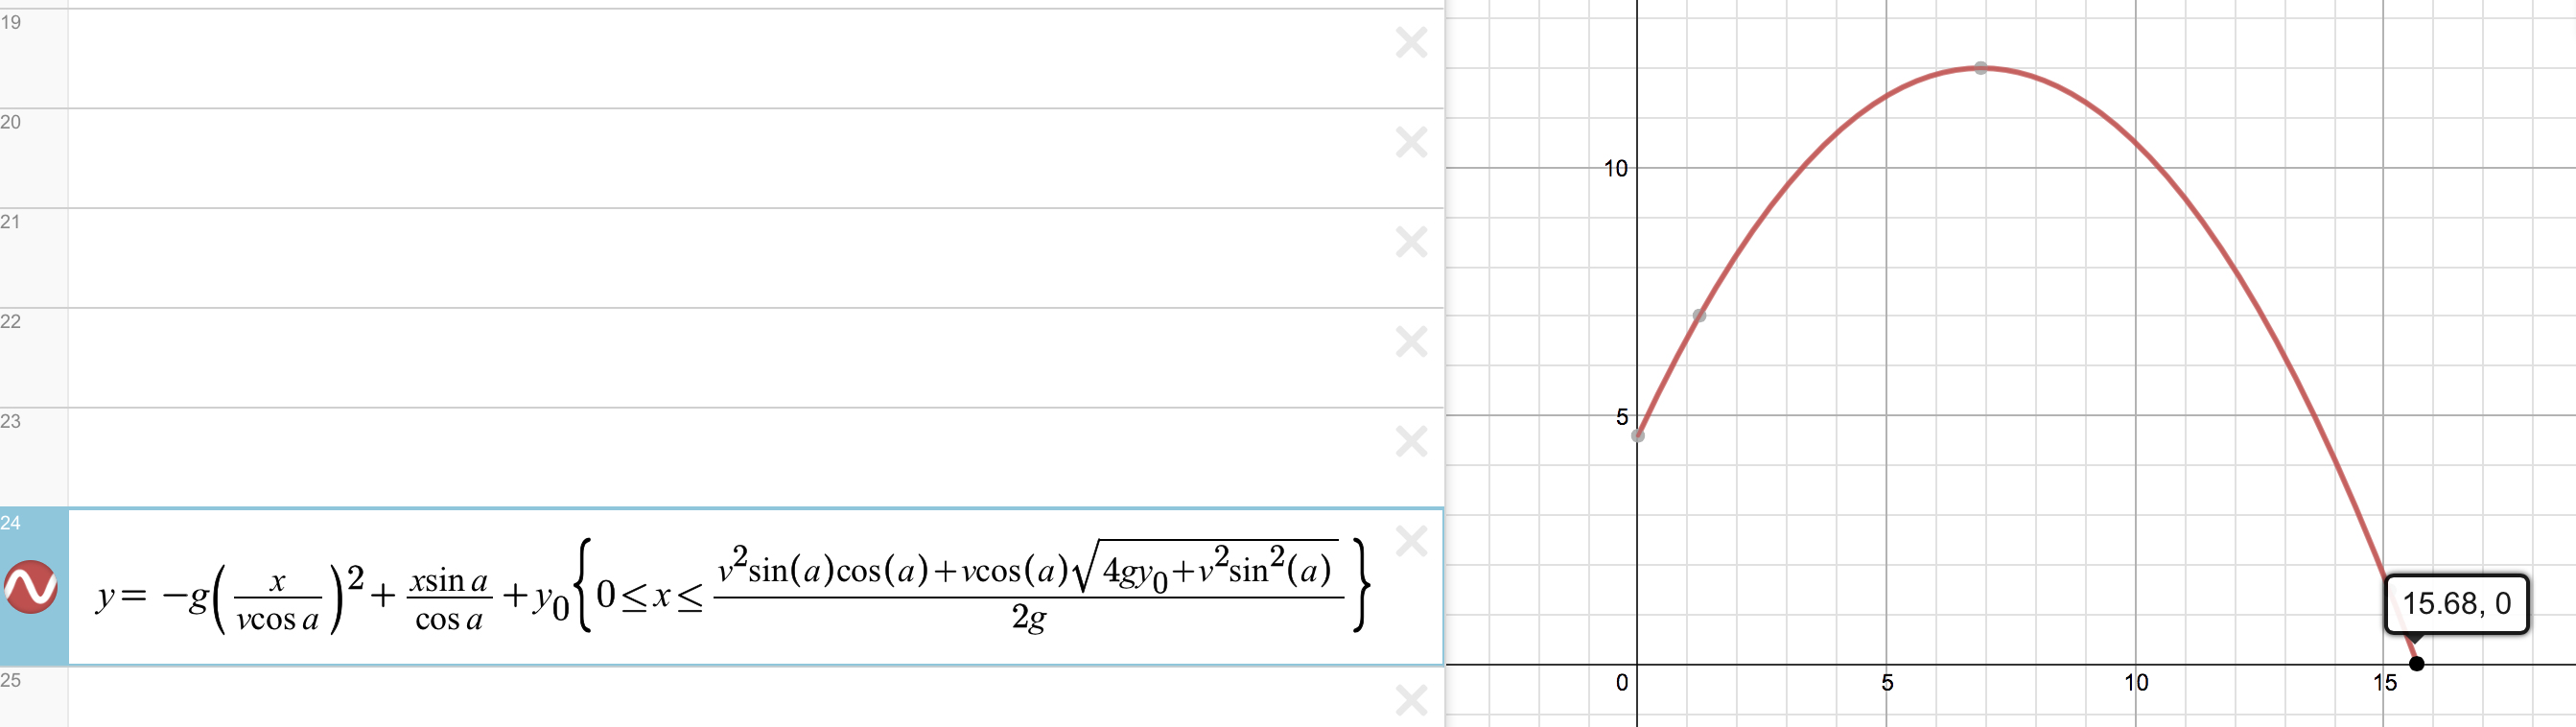
And voila! We arrive at right-hand x-intercept in terms of velocity, gravity, angle of launch and starting height. Now, to put it to the test:
Is this the best or easiest method for solving? Perhaps not. Trig identities would tighten it up a bit. Team Desmos also points out (via a graph with my face that they tweeted to me) that the quadratic formula would be a nice way to go:
But they’re adult math geniuses; for 9th graders, this was an incredible success! Two big points that I took away from this experience, and they’re related to one another (and will be followed up on in another post soon):
1. Technology – and I’m talking Desmos in this case, but this applies to other tech as well – has changed the definition of “age appropriate” with regard to math, and vastly increased the ceiling of what kids can do and make sense of.
2. It’s common to hear math teachers – including me – argue that computers are not a natural medium for doing mathematics. Computers are powerful but come with tradeoffs; pencil-and-paper offers the ease and freedom to scribble that computers don’t, for instance. Personally, I find that I have difficulty thinking through a math problem without paper, and plenty of people I know – kids and adults – feel similarly. This is changing. Desmos has an easy interface, elegant graphics (that don’t look like like ((v(sin(a)^2/cos(a))/sqrt(cos(a)))), and Desmos also offers the opportunity to catch errors with instantaneous visualizations (not to mention the copy-and-paste feature that saved them a ton of time). There’s still a great deal of math that’s best done with paper and pencil, but I think we can safely move this particular task into the “easier on computer” category. Which tasks will join it next?

Hi, Zach,
I really enjoyed reading about your students’ work! I’m a former math teacher and a current programming teacher. I still work on exploring big math topics using Python. I posted a video on YouTube where I took the initial values from your exploration and used Visual Python and vectors to see if that gets the same results as the position formula. I thought you might be interested. http://youtu.be/fzS8jaeI6BM
Enjoy!
Peter Farrell
Pingback: Projectile Motion Project, Pt 6: Untangling on another level | A Math Education That Matters