In my last post, a group of ambitious students had just figured out how to restrict the domain of a quadratic function at its x-intercept and y-intercept; no small feat. Now they had to do the actual project, like everyone else in the class, which was to use quadratic function(s) to model a projectile of their choice – a planned one or a past one that has been filmed. They countered my assignment with an e-mail, which I’ll excerpt:
Our final goal is to create an equation where you can input any target, any velocity, and any height, and find the angle necessary to hit the target.
So, that became their project. Before going any further, they gave themselves a simple, concrete challenge:
There’s a projectile launched at an initial height of 20 feet with an initial velocity of 50 ft/sec. We want it to land 70 feet away. Under normal gravity and with no wind resistance, what angle is necessary?
They decided to plug into their general formula to try to solve this. “x” in the equation below, is the launch angle:

With only one variable, this should theoretically be a solvable equation. Since this was certainly beyond their solving capabilities, they plugged it into Desmos in the hopes that Desmos would solve it for them. No luck. Then they tried wolframalpha, which required typing it out like this:

So wolframalpha read their input correctly, but the result, shown below, made no sense to them, and at first, made no sense to me either:
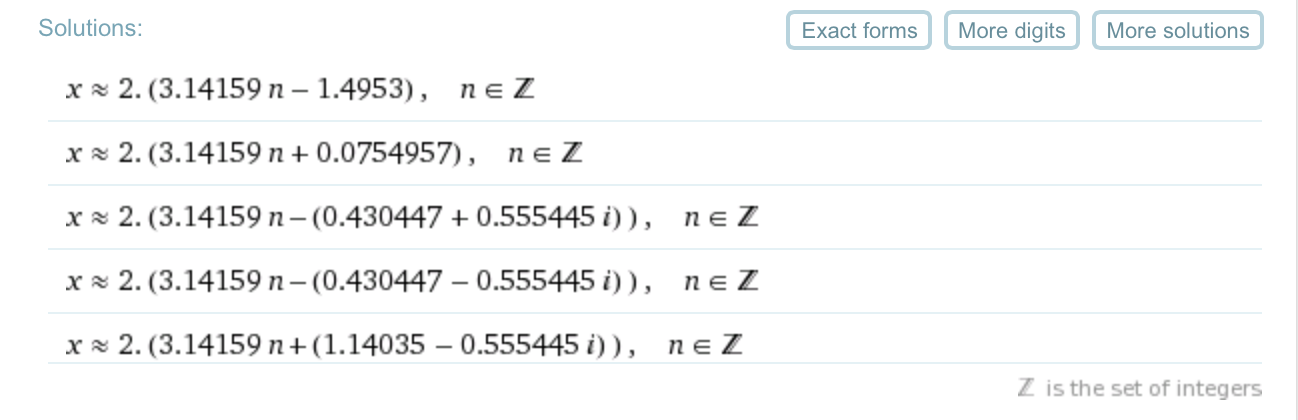
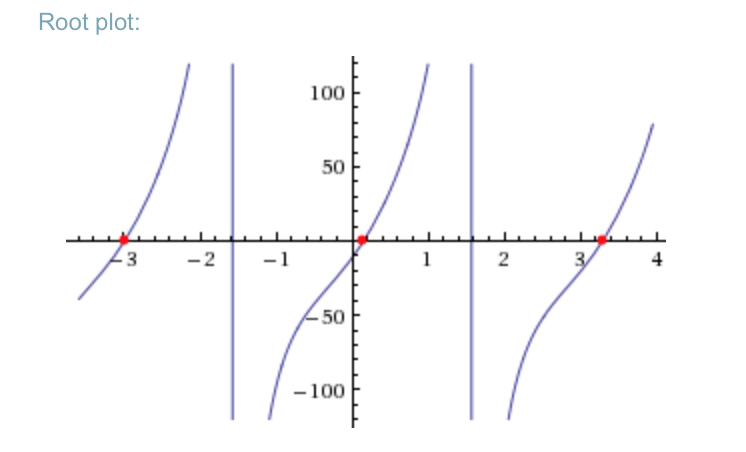
Why is there a seemingly endless supply of answers? And what the heck is that graph telling us? What are on those axes? Not only were the kids stumped. I was stumped. I was working on this in the wee hours, thinking this might be the end of the fun. Then with a single keystroke, it was back! Everything, including the wolframalpha mess, became clear.
I wrote my students an e-mail, making a suggestion of what they should do next. I’ll excerpt my e-mail below. It started with the equation they were trying to solve:
Now, replace 0 with y (and make sure your Desmos graph is in DEGREE mode). Look to see all the places on the graph where y = 0 (the x-intercepts). Think about these questions:
- What is the significance of these x-intercepts?
- Why are there so many?
- How did the wolfram solution list all these solutions? (because they did)
- How could you solve this problem if the point we were trying to hit wasn’t (70, 0)?
- How could we generalize/formalize this process?
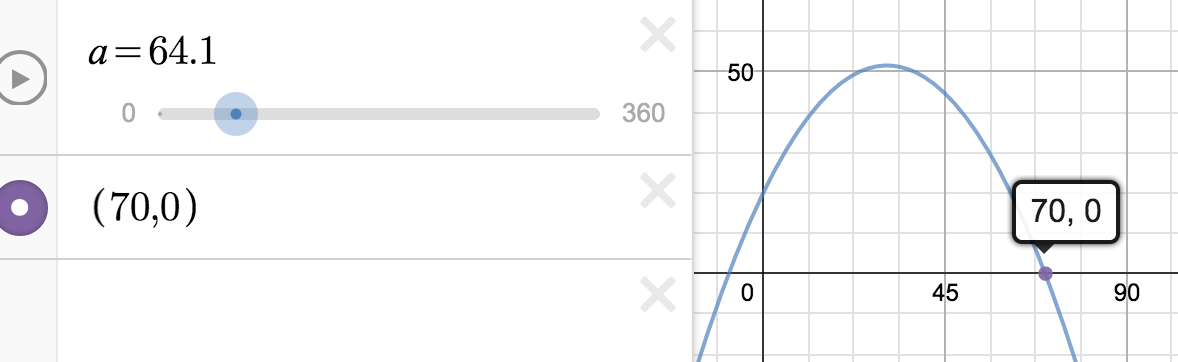
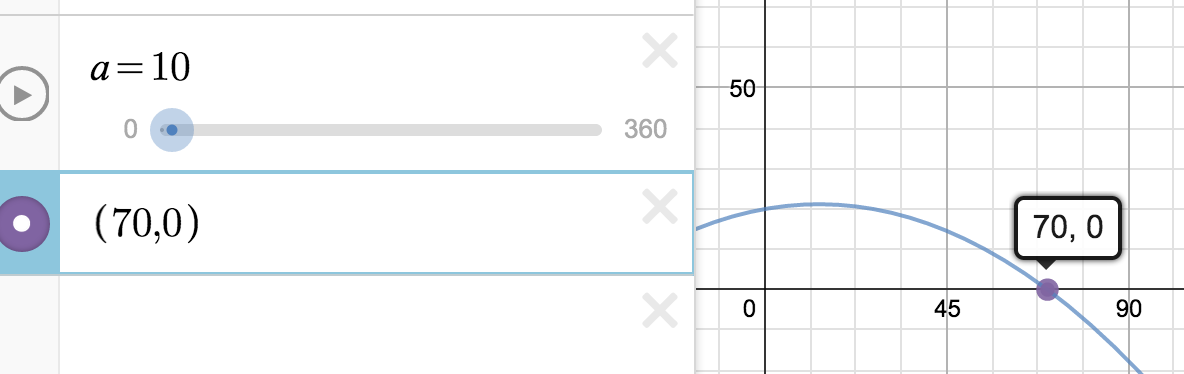
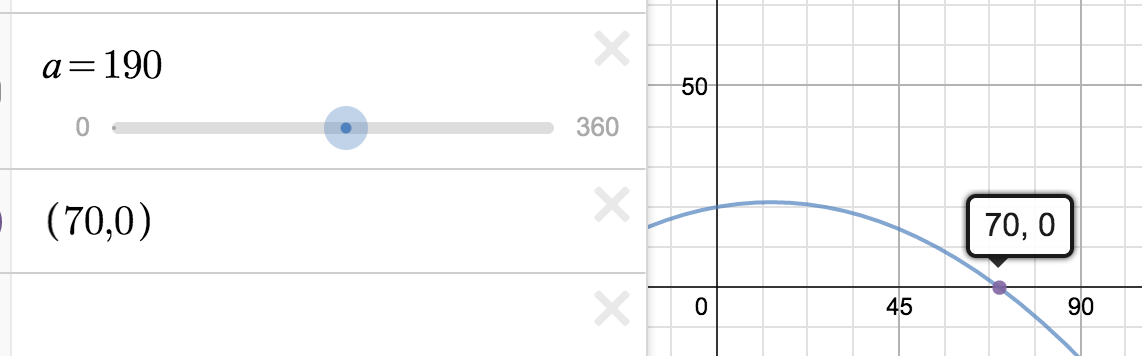
The graph they’d be looking at is this, each x-intercept being an angle that will hit the point (0, 70) given the other parameters:

It’s difficult to look at this graph and resist the urge to test it to see if it actually works. I did that (before e-mailing the students – not to avoid potentially sending them misinformation, but because I just HAD to know), and then the students did that. Sure enough:

There’s plenty to talk about mathematically here, but the most important part of this for me was that – despite our initial difficulty in making technology work for us – we persevered, I became useful to these kids for one split second, and the fun continued. Stay tuned.

Pingback: Projectile Motion Project, Pt 6: Untangling on another level | A Math Education That Matters